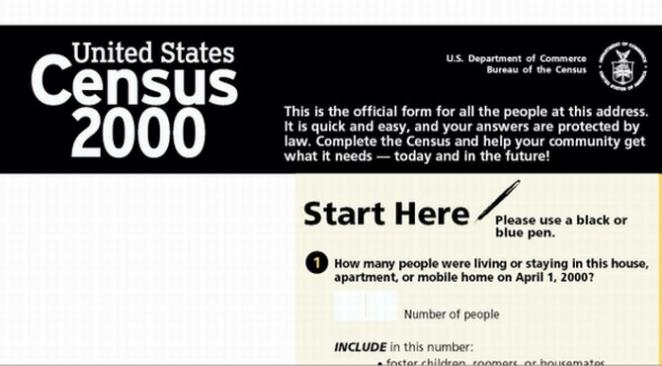
Decennial Census 2000

Every ten years, the Census Bureau conducts a constitutionally-mandated national household survey to count every resident in the United States. The federal government uses Decennial Census data for apportioning congressional seats, for identifying distressed areas, and for many other activities. Census data was collected using two survey forms: the short form and the long form. Short form information is collected on every person and includes basic characteristics, such as age, sex, and race. The long form was sent to one out of every six households and collects more detailed information, such as income, housing characteristics, and employment. (The American Community Survey has since replaced the Long Form data.) Most of the indicators in the summary file are from the long form, and are thus estimates based on the sample of households. These values may differ considerably from the same indicators based on the Short Form data, particularly for small areas. For more information, visit the Census web site at http://www.census.gov/main/www/cen2000.html.
Across the Indianapolis region, neighborhoods have experienced rapid cultural changes and shifting housing demand. In June, The Polis Center facilitated a community conversation about neighborhood-... [read more]
GPP's new research platform, the Housing Data Hub, is now live!
GPP’s Housing Data Hub (HDH) provides the public, policy makers, and the media access to a curated set of timely housing-... [read more]
The Southwestern Pennsylvania Community Profiles presents community data and indicators from dozens of sources in a series of interactive tables, maps, and charts. The tool was built by our... [read more]
For almost a decade the Providence Neighborhood Profiles have been a critical resource for government, community organizations, and people simply interested in learning about the City. With generous... [read more]
UCSUR is currently studying the residential housing market in South Pittsburgh’s Hilltop communities. This analysis will help the Hilltop Alliance and stakeholders in member neighborhoods... [read more]
We created two interactive data visualizations using Tableau Public.
One illustrates population changes from 2000 to 2010, as well as population projections by race and age for five year increments... [read more]
The Poverty Center's Neighborhood Stabilization Team Web Application (NST Web App) was selected as a Leadership in Community Innovation Award finalist. Four finalist groups competed for the... [read more]
Metropolitan Philidelphia Indicators Project released their most recent policy brief on charter school locations and falling enrollment in traditional public schools.
[read more]
The Urban Institute, and GeoLytics, Inc., a private firm specializing in the development of demographic and geographic data products, are producing an update of an important data resource that... [read more]
We are starting a new report series focused on demographics in which we will explore diversity in Central Indiana through the lenses of race and ethnicity, income, and age. The first report,... [read more]
NeighborhoodInfoDC has been providing data and analysis supporting the new Kids Count grantee (DC Action for Children). We released the first of a series of policy briefs based on the 2010 Census in... [read more]
Eight partners were selected through a competitive process to participate in the initiative (see partners listed on the right). The project utilized the work of Charlie Bruner (Des Moines) who... [read more]
Variations in neighborhood conditions are critical to health outcomes and program options in America. In almost all urban areas, serious health problems are highly concentrated in a fairly small... [read more]

